Google Maps API Part 1
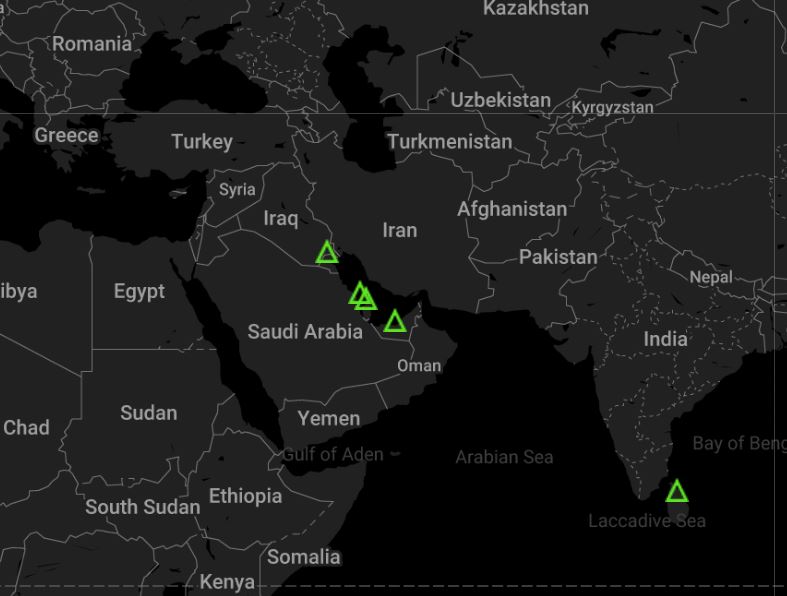
This segment on my blog will be part of a large series on using the Google Maps API. Part one will cover rendering a basic map with a few places I have been to in 2018. First thing is first, a lot of information on the API can be found here.
Where to start was the question, well I needed a list of all of the countries in the world along with their Latitude (LAT) and Longitude (LONG). I was able to find that here.
So for my map I have the following:
Kuwait, Bahrain, Qatar, UAE, Sri Lanka
So the basic HTML upto the body tag. In a nutshell we are creating a map element in CSS with a 100% width so it takes up the whole screen and setting some html and body settings.
<!DOCTYPE html>
<html>
  <head>
    <title>Location History IRL</title>
    <meta name="viewport" content="initial-scale=1.0, user-scalable=no">
    <meta charset="utf-8">
    <style>
      /* Always set the map height explicitly to define the size of the div
       * element that contains the map. */
      #map {
        height: 100%;
      }
      /* Optional: Makes the sample page fill the window. */
      html, body {
        height: 100%;
        margin: 0;
        padding: 0;
      }
 }
    </style>
  </head>
<body>
Next, lets add the div and render the map. The first part styles this, there is a whole page on this on the Google Maps API page located <a href=”https://developers.google.com/maps/documentation/javascript/styling”>here</a>.
After this we set the zoom level and where the map is centered, please note I did this on a 4k monitor so you might need to adjust the zoom level and where you want it centered. I didnt want to use the default pin drop style icon, so I made my own, hosted it on AWS and used that. Finally I commented each place I had been to this year and added the LAT and LONG for it. The last item you will need to set is your API key.
<div id="map"></div>
    <script>
      function initMap() {

        // Create a new StyledMapType object, passing it an array of styles,
        // and the name to be displayed on the map type control.
        var styledMapType = new google.maps.StyledMapType(
            [
        {
        "elementType": "geometry",
        "stylers": [
          {
          "color": "#212121"
          }
        ]
        },
        {
        "elementType": "labels.icon",
        "stylers": [
          {
          "visibility": "off"
          }
        ]
        },
        {
        "elementType": "labels.text.fill",
        "stylers": [
          {
          "color": "#757575"
          }
        ]
        },
        {
        "elementType": "labels.text.stroke",
        "stylers": [
          {
          "color": "#212121"
          }
        ]
        },
        {
        "featureType": "administrative",
        "elementType": "geometry",
        "stylers": [
          {
          "color": "#757575"
          }
        ]
        },
        {
        "featureType": "administrative.country",
        "elementType": "labels.text.fill",
        "stylers": [
          {
          "color": "#9e9e9e"
          }
        ]
        },
        {
        "featureType": "administrative.land_parcel",
        "stylers": [
          {
          "visibility": "off"
          }
        ]
        },
        {
        "featureType": "administrative.locality",
        "elementType": "labels.text.fill",
        "stylers": [
          {
          "color": "#bdbdbd"
          }
        ]
        },
        {
        "featureType": "poi",
        "elementType": "labels.text.fill",
        "stylers": [
          {
          "color": "#757575"
          }
        ]
        },
        {
        "featureType": "poi.park",
        "elementType": "geometry",
        "stylers": [
          {
          "color": "#181818"
          }
        ]
        },
        {
        "featureType": "poi.park",
        "elementType": "labels.text.fill",
        "stylers": [
          {
          "color": "#616161"
          }
        ]
        },
        {
        "featureType": "poi.park",
        "elementType": "labels.text.stroke",
        "stylers": [
          {
          "color": "#1b1b1b"
          }
        ]
        },
        {
        "featureType": "road",
        "elementType": "geometry.fill",
        "stylers": [
          {
          "color": "#2c2c2c"
          }
        ]
        },
        {
        "featureType": "road",
        "elementType": "labels.text.fill",
        "stylers": [
          {
          "color": "#8a8a8a"
          }
        ]
        },
        {
        "featureType": "road.arterial",
        "elementType": "geometry",
        "stylers": [
          {
          "color": "#373737"
          }
        ]
        },
        {
        "featureType": "road.highway",
        "elementType": "geometry",
        "stylers": [
          {
          "color": "#3c3c3c"
          }
        ]
        },
        {
        "featureType": "road.highway.controlled_access",
        "elementType": "geometry",
        "stylers": [
          {
          "color": "#4e4e4e"
          }
        ]
        },
        {
        "featureType": "road.local",
        "elementType": "labels.text.fill",
        "stylers": [
          {
          "color": "#616161"
          }
        ]
        },
        {
        "featureType": "transit",
        "elementType": "labels.text.fill",
        "stylers": [
          {
          "color": "#757575"
          }
        ]
        },
        {
        "featureType": "water",
        "elementType": "geometry",
        "stylers": [
          {
          "color": "#000000"
          }
        ]
        },
        {
        "featureType": "water",
        "elementType": "labels.text.fill",
        "stylers": [
          {
          "color": "#3d3d3d"
          }
        ]
        }
      ],
            {name: 'Styled Map'});

        // Create a map object, and include the MapTypeId to add
        // to the map type control.
        var map = new google.maps.Map(document.getElementById('map'), {
          center: {lat: 33.573, lng: 7.589},
          zoom: 3.3,
      draggable: false,
          mapTypeControlOptions: {
            mapTypeIds: ['roadmap', 'satellite', 'hybrid', 'terrain',
                    'styled_map']
          }
        });

    var iconBase = 'https://s3.eu-central-1.amazonaws.com/darkfieldmatrix.ae/images/';
        var icons = {
          info: {
            name: 'Info',
            icon: iconBase + 'beacon16.png'
          }
        };

    var features = [
          {
      // Bahrain
      position: new google.maps.LatLng(25.930414, 50.637772),
            type: 'info',
      title: 'Bahrain<br />'
          }, {
      // Kuwait
      position: new google.maps.LatLng(29.31166, 47.481766),
            type: 'info',
      title: 'Kuwait<br />'
          }, {
      // Qatar
      position: new google.maps.LatLng(25.354826, 51.183884),
            type: 'info',
      title: 'Qatar<br />'
          }, {
      // Sri Lanka
      position: new google.maps.LatLng(7.873054, 80.771797),
            type: 'info',
      title: 'Sri Lanka<br />'
          },{
      // United Arab Emirates
            position: new google.maps.LatLng(23.424076, 53.847818),
            type: 'info',
      title: 'United Arab Emirates<br />'
          },
        ];


    // Create markers.
        features.forEach(function(feature) {
      var marker = new google.maps.Marker({
        position: feature.position,
        icon: icons[feature.type].icon,
        map: map
      });
      // Create popup windows
      var infowindow = new google.maps.InfoWindow({
        content: feature.title
      });
        marker.addListener('click', function() {
        infowindow.open(map, marker);
      });
      });


        //Associate the styled map with the MapTypeId and set it to display.
        map.mapTypes.set('styled_map', styledMapType);
        map.setMapTypeId('styled_map');
      }
    </script>
    <script async defer
    src="https://maps.googleapis.com/maps/api/js?key=<YOUR API KEY HERE>&callback=initMap">
    </script>
  </body>
</html>
For this week this is all I have on this; in the next segment I would like to tie this into a MySQL database and store countries there. The is available on Github here. Below is a screenshot of what it looks like.
